Is Generation X ready for retirement? Not even close.
The typical Gen X household, now in their late 40s to early 60s, has just $115,000 in median retirement savings, according to the Federal Reserve’s Survey of Consumer Finances. That’s far below the levels Baby Boomers had at the same age and places this generation at a serious disadvantage.
Gen X also carries significant debt. Their average credit card balance reached $9,123 in 2024, higher than any other age group. And total consumer debt for Gen X topped $6.5 trillion in 2024, according to Experian analysis.
Homeownership might look like a bright spot: nearly 73% of Gen X households own their home. But that equity is tied up in bricks and mortar. Rising interest rates and inflation have made it harder to tap into that wealth for day-to-day expenses or retirement planning.
Instant Valuation, Confidential Deals
with a Certified iBuyer.com Specialist.
Sell Smart, Sell Fast, Get Sold. No Obligations.
To make matters more complex, many Gen Xers are the “sandwich generation,” supporting both their kids and aging parents at once. That dual responsibility is draining savings, delaying retirement, and forcing risky financial decisions like early 401(k) withdrawals.
This report digs into Generation X retirement savings in 2025. We use public data from the Federal Reserve, Experian, Redfin, and others to explore savings shortfalls, debt burdens, home equity, and regional trends that shape this generation’s retirement readiness.
The findings are clear: Gen X is heading toward a retirement cliff, and they are not ready.
Generation X Retirement Savings Snapshot (2025)
When you look at the numbers, it’s clear why Generation X retirement savings are falling short.
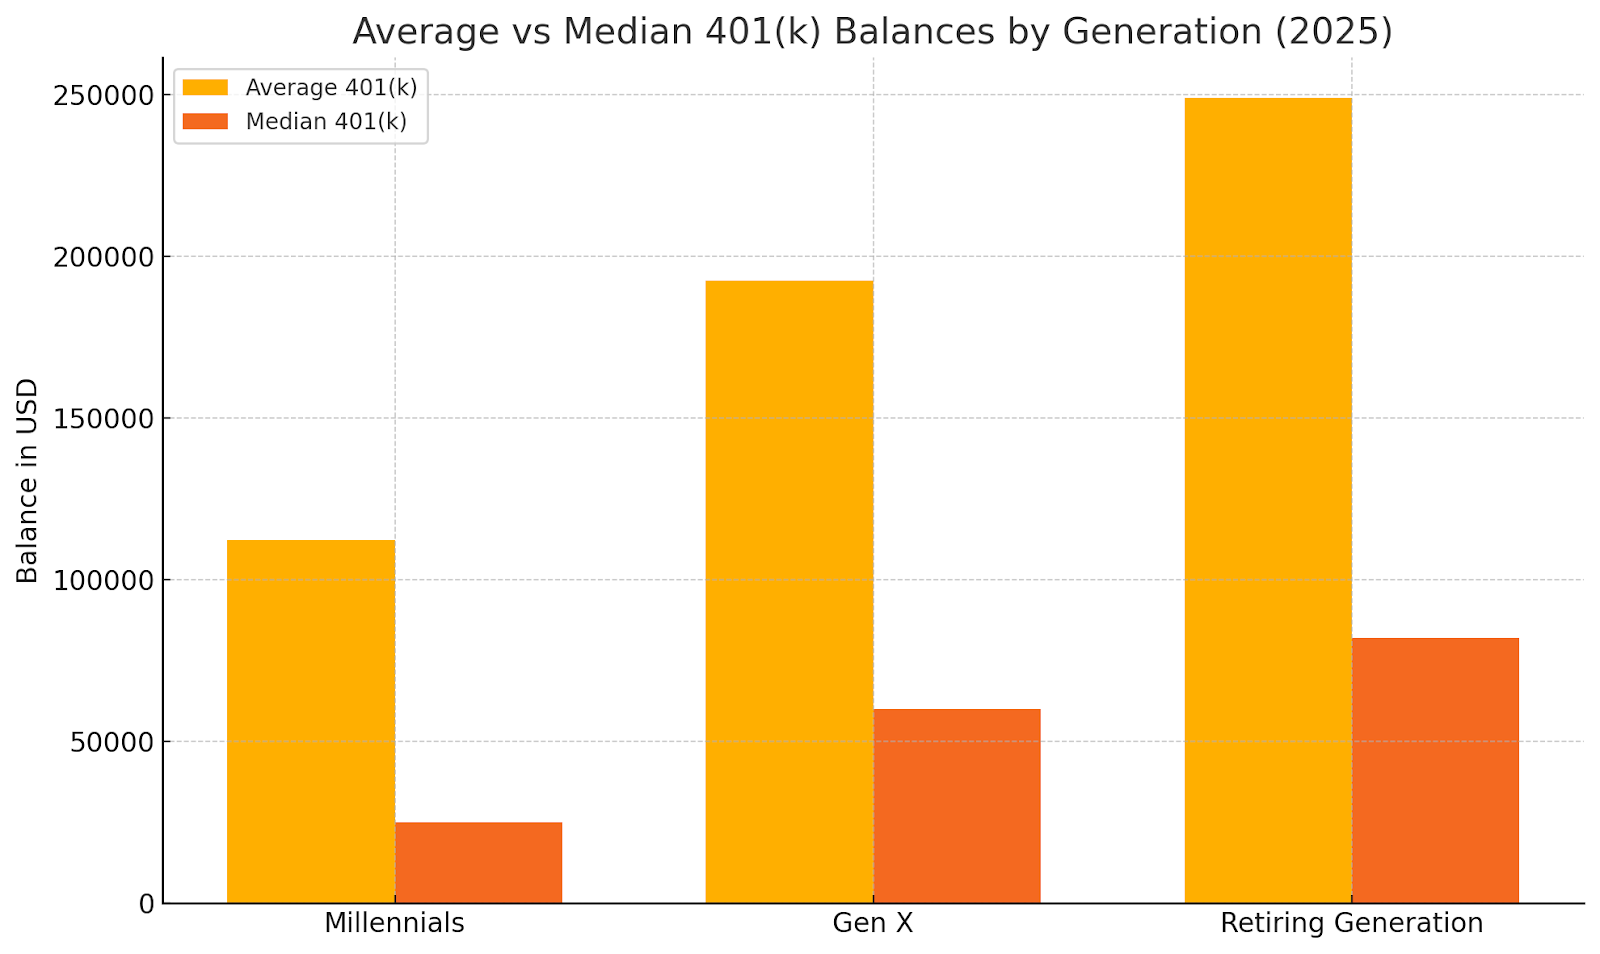
First, let’s talk averages. According to Fidelity’s Q4 2024 retirement analysis, Gen Xers in 401(k) plans hold an average balance of $192,300, while those with IRAs average $103,952 .
But averages can be misleading. The Federal Reserve’s Survey of Consumer Finances shows that the median Gen X household has only $40,000 to $115,000 saved for retirement . That falls far short of the $500,000 to $1 million financial planners often recommend.
Confidence in retirement is low. A 2023 Transamerica survey found only 19% of Gen X workers feel “very confident” about retiring comfortably . More than half contribute less than 10% of their income to retirement, and around 20% have taken a loan or early withdrawal from a retirement account .
The problem isn’t just low savings. It’s also a shrinking runway. Many Gen Xers are already in their 50s, and time to rebound financially is running thin.
Gen X Debt Burdens and Retirement Delays
While savings are one side of the equation, debt is the other, and for Generation X, that debt is hefty.
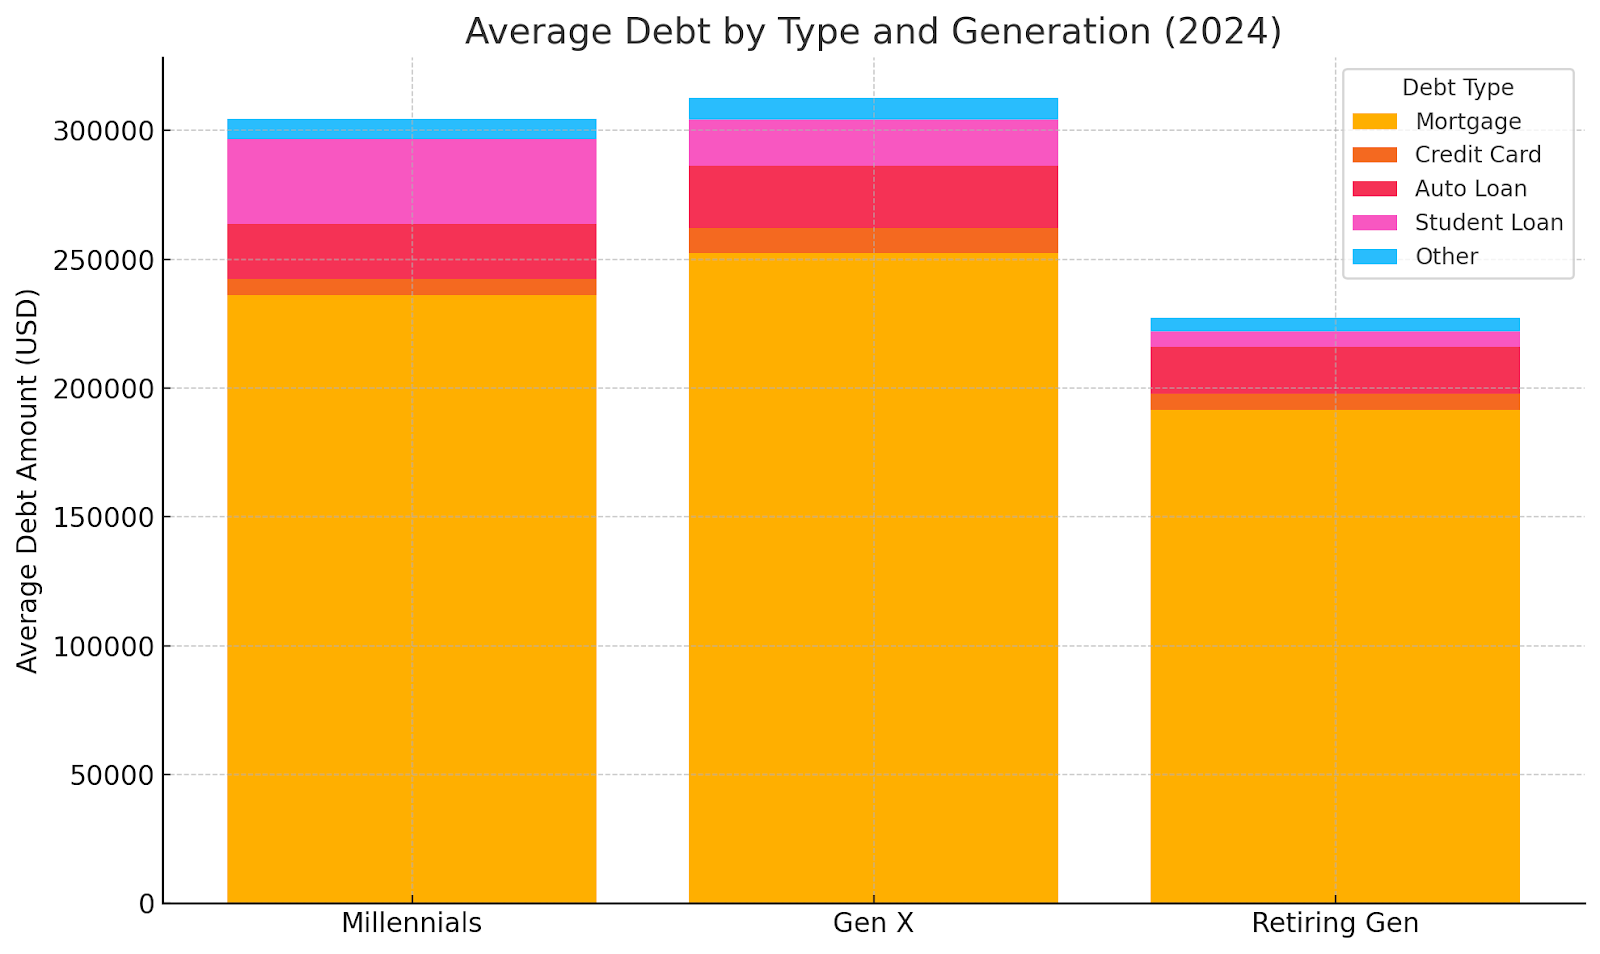
According to Experian’s 2024 Consumer Credit Review, Gen X carries more total debt than any generation. Their average credit card balance reached $9,557 in 2024, up from $9,123 the previous year. Average mortgage debt also rose to $252,505, while auto loan balances neared $24,297 .
All told, total Gen X consumer debt topped $6.5 trillion last year, more than any other generation .
This debt has direct implications for retirement. A recent Nationwide survey found that 44% of Gen X workers expect to retire at age 66 or later, several years past the U.S. median of 62 . It also reported that 26% of Gen Xers say inflation pushed back their retirement, while 24% have taken on credit card debt to help family .
The high debt load is dragging their retirement timeline. With rising debt payments, many Gen Xers are forced to delay retirement, reduce savings, or tap into retirement funds early.
Home Equity and Housing Market Trends
If there’s one area where Generation X looks stronger, it’s homeownership. According to Redfin’s 2024 homeownership report, about 73% of Gen X households own a home. That puts them ahead of Millennials (55%) and far ahead of Gen Z (26%).
The catch? That equity is often locked in.
Many Gen Xers bought their homes in the 1990s or early 2000s, which means they’ve seen solid appreciation. But tapping into that value is harder now. High mortgage rates, tighter lending conditions, and fewer cash-out refinance options have made it difficult to unlock home equity without selling.
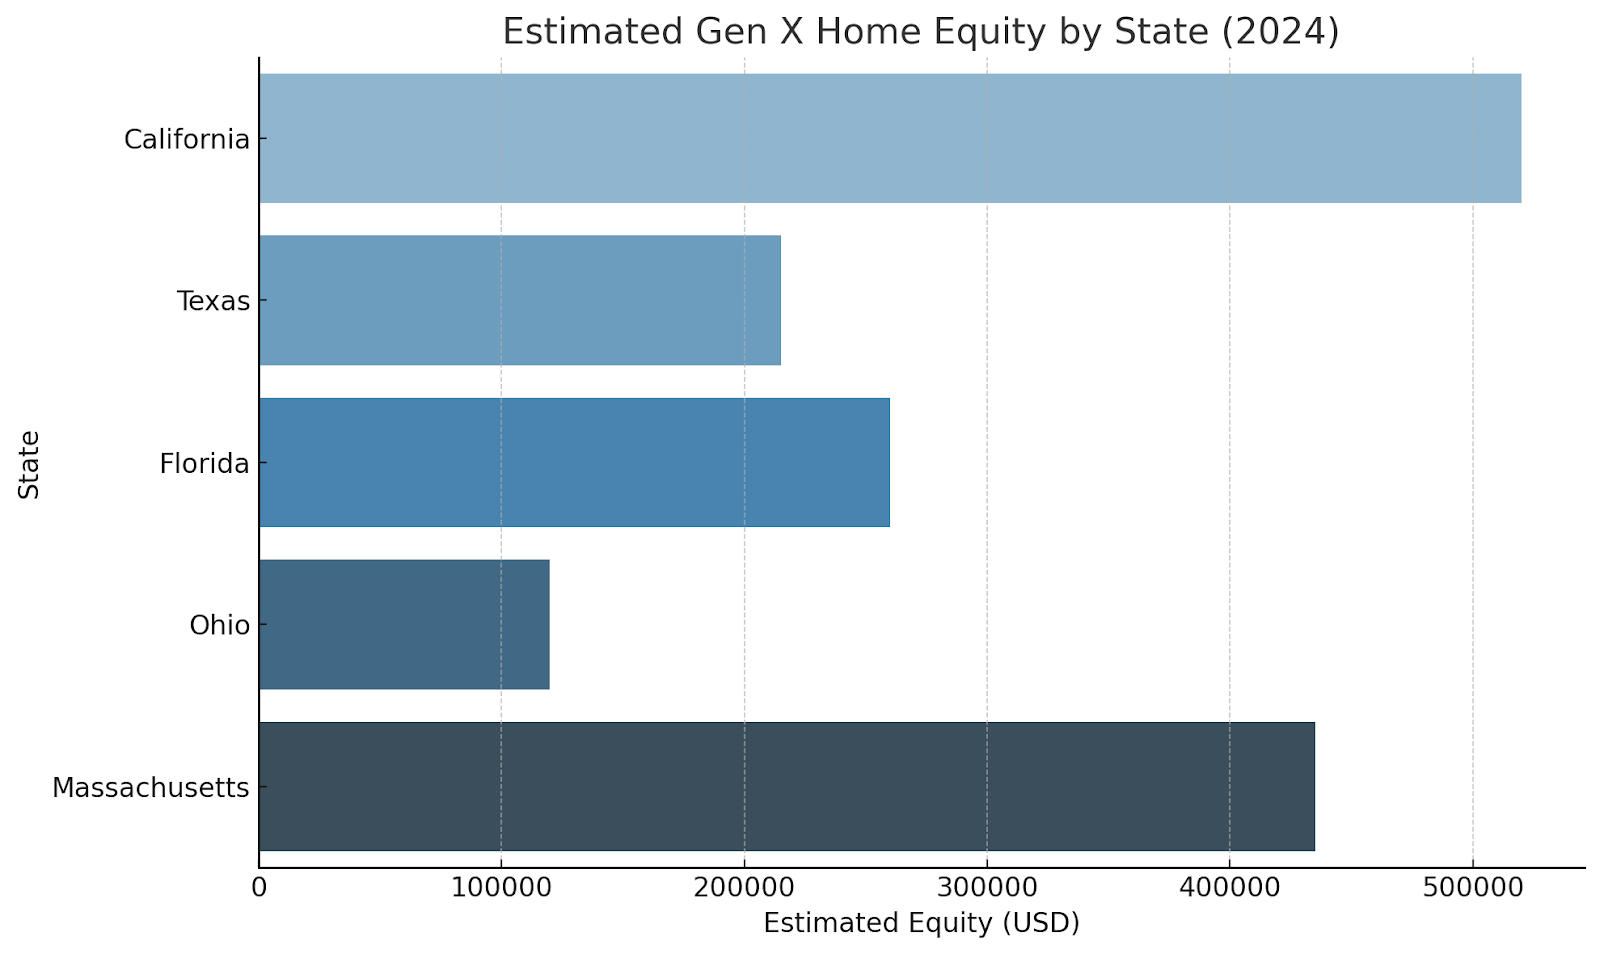
In 2024, the typical U.S. home was valued at around $343,000 according to Zillow. But that number varies widely by region. In high-cost metros like San Francisco or Boston, Gen X homeowners may be sitting on $500K or more in equity. In lower-cost regions like the Midwest or rural South, that number might be half as much.
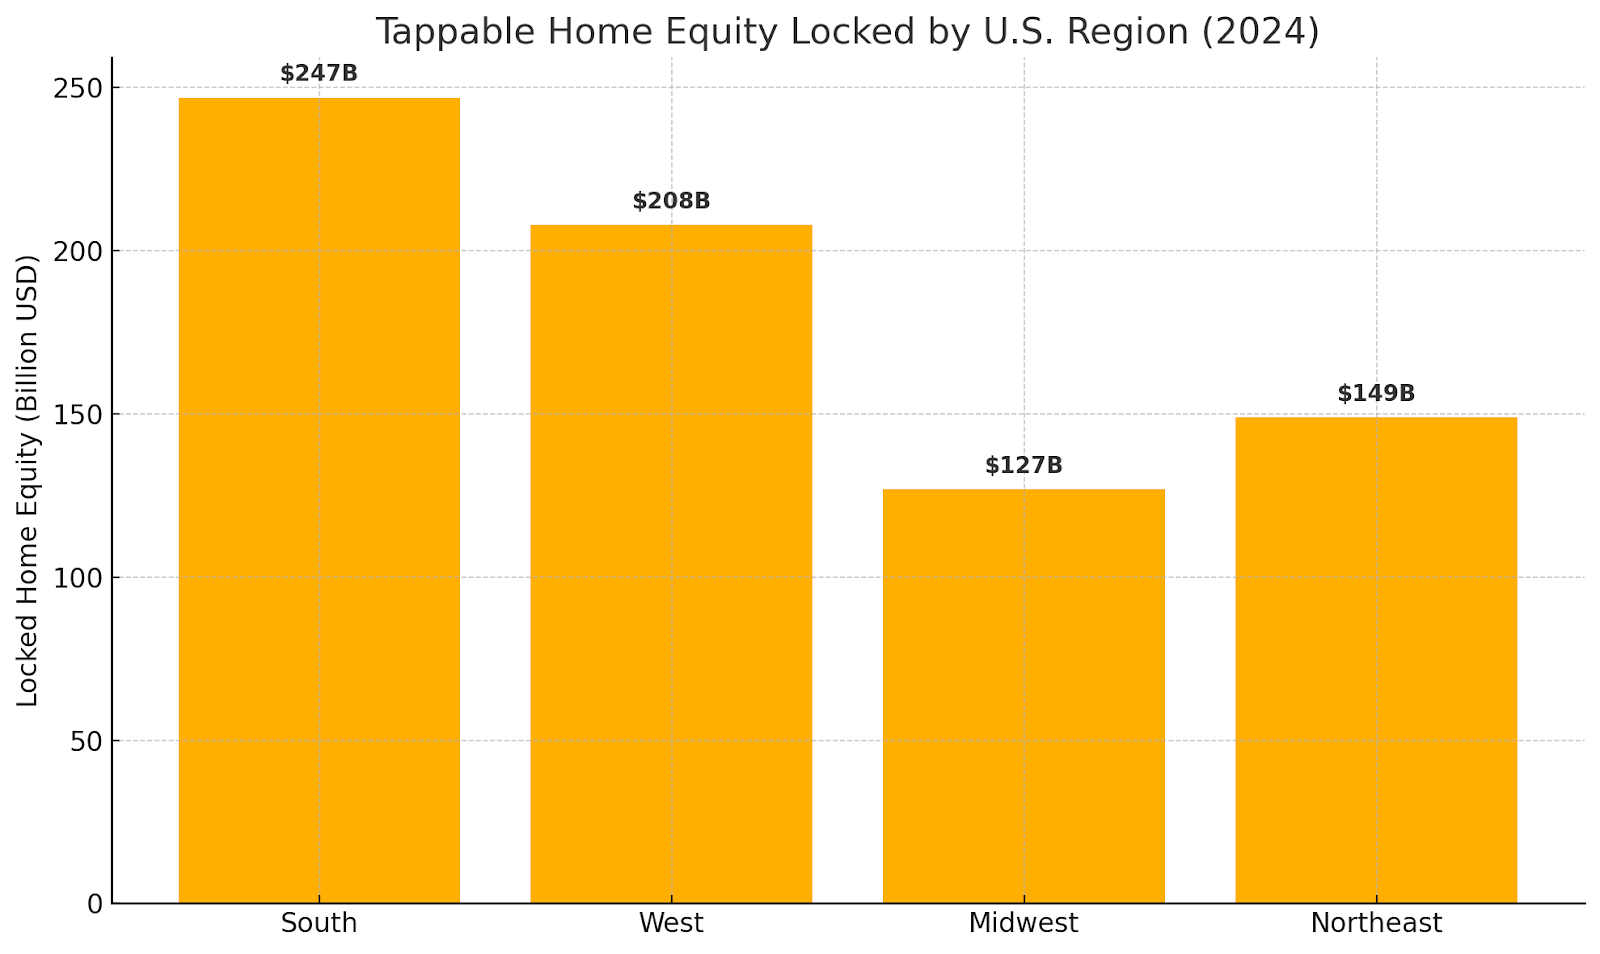
A 2024 report by Point and The Urban Institute estimated that more than $731 billion in home equity is effectively inaccessible due to market conditions. The South accounted for the largest share, about $247 billion, highlighting the regional imbalance in housing wealth.
The Sandwich Generation Squeeze
Generation X is stuck in the middle. Many are raising kids while also supporting aging parents. This double burden is one of the biggest threats to their retirement savings.
In 2024, a Nationwide Retirement Institute survey found that over 50% of Gen Xers are financially supporting either their children, their parents, or both. That support often comes at the cost of retirement planning.
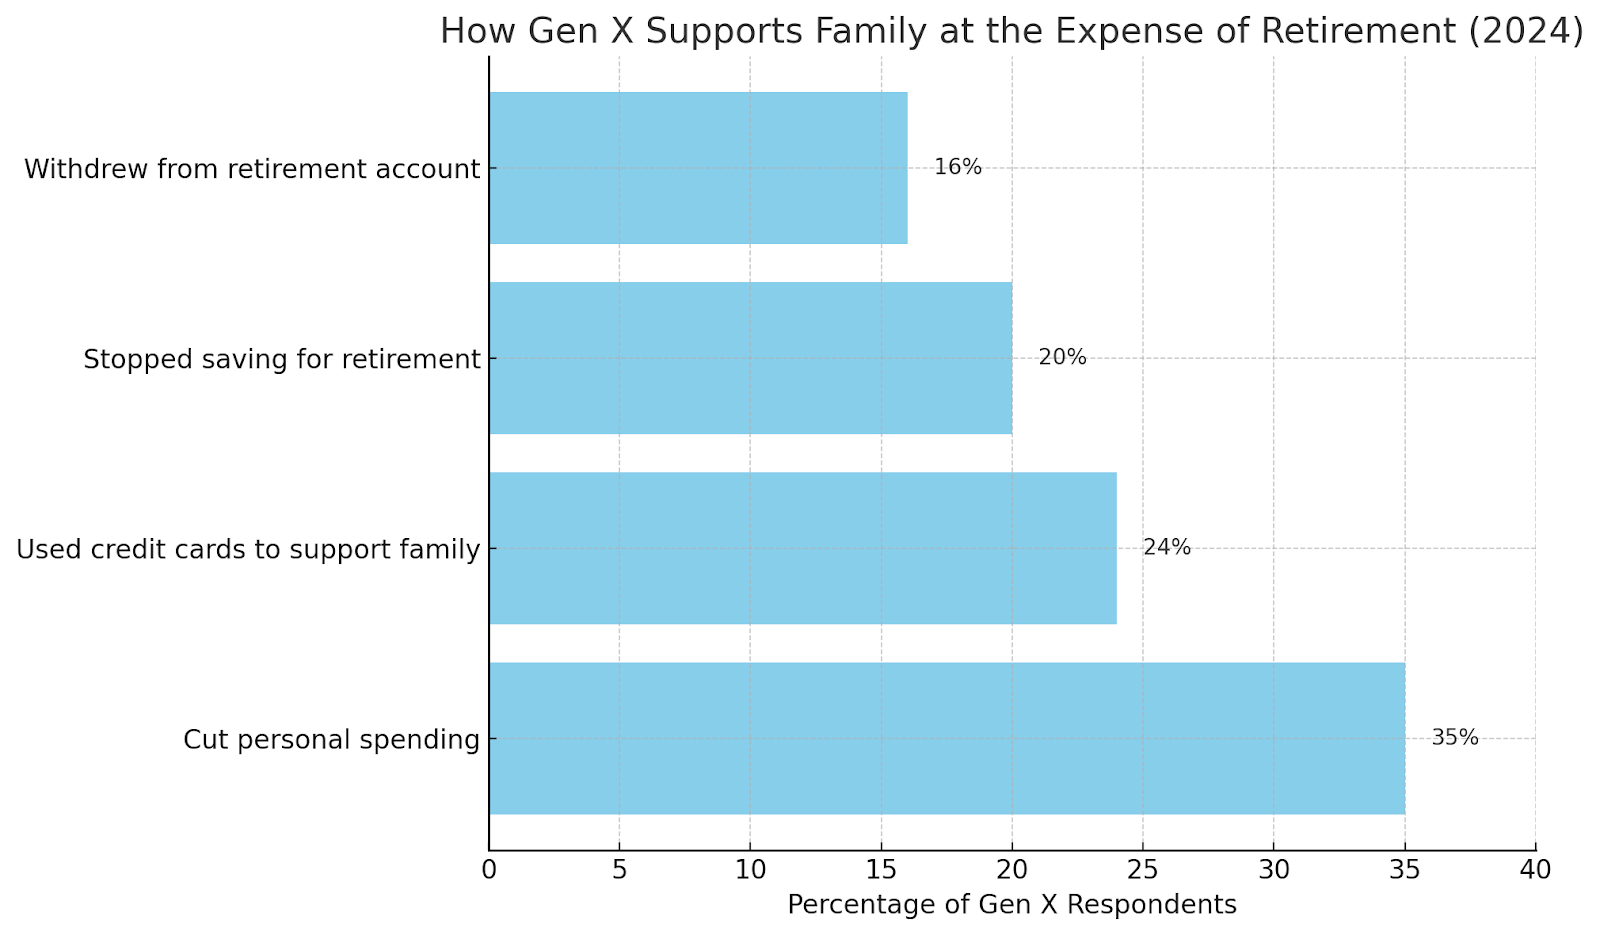
Here’s what that looks like in practice:
- 24% of Gen Xers reported running up credit card debt to help family
- 35% said they had to cut back on their own personal spending
- 20% said they’ve stopped saving for retirement entirely
- 16% have withdrawn money early from a retirement account
This is more than just anecdotal pressure. Gen X is financially stretched in both directions, which has a direct impact on long-term planning.
College costs, elder care, and day-to-day household expenses are forcing difficult choices. Many are putting family first and retirement last.
Regional Trends in Gen X Wealth
Not all Gen Xers are facing the same retirement outlook. Where they live makes a big difference in how much they’ve saved, how much equity they hold, and how far their money goes.
Start with home values. According to the Zillow Home Value Index, the median home price in San Jose, California sits above $1.3 million, while in places like Cleveland, Ohio, it’s closer to $175,000. A Gen X homeowner in California might have far more equity on paper, but their cost of living is also significantly higher.
The Point and Urban Institute study broke down locked equity by region. The South accounted for $247 billion, the West for $208 billion, and the Northeast for $149 billion. That suggests Gen Xers in the South may be equity-rich, but with limited liquidity due to high interest rates or credit issues.
On the retirement savings side, the picture is less clear. The Federal Reserve doesn’t publish retirement balances by state, but studies show that net worth and savings rates vary widely. Households in states like Massachusetts, California, and Washington tend to have higher retirement savings, while those in Southern or rural states report much lower balances.
The takeaway? Gen Xers in high-cost states may be “house rich but cash poor.” Others in lower-cost areas may struggle with low wages and limited access to retirement plans. Geography plays a major role in both opportunity and risk.
A Generation Under Pressure
Generation X is facing a retirement reality that looks very different from the one Baby Boomers stepped into.
They’ve saved less. They’re carrying more debt. And many are caught in the financial squeeze of supporting two generations at once. On paper, homeownership is a bright spot, but tapping that equity isn’t always easy or timely.
In 2025, Gen X isn’t just behind the curve. They’re racing against the clock.
The numbers tell the story:
- Median retirement savings of around $115,000
- Over $9,000 in credit card debt, on average
- Delayed retirement plans for nearly half of the generation
- Trillions in home equity locked by market conditions
And the gap is widening. Rising housing costs, inflation, and fewer defined-benefit pensions mean Gen X may be the first generation to retire with less security than the one before it.
This isn’t just a financial issue. It’s a demographic shift with long-term consequences for families, communities, and the economy.
For Gen X, the next decade will be defined by one question: Can they catch up before time runs out?
Compare Cash Offers from Top Home Buyers.
Delivered by Your Local iBuyer Certified Specialist.
One Expert, Multiple Offers, No Obligation.
Frequently Asked Questions
What is the average retirement savings for Gen X in 2025?
According to Fidelity, Gen X workers in 2025 have an average 401(k) balance of about $192,300 and an average IRA balance of $103,952. However, the median retirement savings is closer to $115,000, which means many Gen Xers have far less.
How much debt does the average Gen X household carry?
Experian’s 2024 credit report shows Gen X has the highest total debt load of any generation, over $6.5 trillion in total. This includes an average credit card balance of $9,557, a mortgage balance of around $252,000, and additional auto, student, and personal loan debts.
Why is Gen X called the “sandwich generation”?
Gen X is often called the sandwich generation because many are supporting both aging parents and their own children at the same time. This financial pressure forces many to reduce or pause retirement contributions, and in some cases, to take on new debt or withdraw from savings early.
How many Gen Xers own a home?
According to Redfin, about 73% of Gen X households own their home in 2024. While this gives them equity, much of it is currently locked due to high interest rates and limited refinance opportunities.
Is Gen X on track to retire?
Most experts agree that Gen X is not on track for a financially secure retirement. Low savings, high debt, and delayed retirement timelines are widespread. A Nationwide survey found that only 19% of Gen X workers feel “very confident” about their ability to retire comfortably.
Methodology
This study is based on publicly available data sources as of 2024 and early 2025. It focuses on U.S. adults born between 1965 and 1980, commonly defined as Generation X.
Data Sources
We used the following data and reports to inform our analysis:
Visuals and Estimations
All charts and graphs were created using data from the sources above. Where only national-level data was available, reasonable estimates were made for specific age bands or regions using breakdowns provided by the source.
Limitations
Some financial data is only available in broad age brackets (e.g., ages 45–54 or 55–64), which may include individuals slightly outside the Gen X range. Where this occurred, we selected the most relevant subgroup. Retirement savings and debt data also rely on self-reported values and household averages, which may not reflect individual cases.
This report does not include proprietary or survey data collected by iBuyer.com. All information is derived from independent, third-party public sources.
Reilly Dzurick is a seasoned real estate agent at Get Land Florida, bringing over six years of industry experience to the vibrant Vero Beach market. She is known for her deep understanding of local real estate trends and her dedication to helping clients find their dream properties. Reilly’s journey in real estate is complemented by her academic background in Public Relations, Advertising, and Applied Communication from the University of North Florida.


