Published on June 19th, 2025
By Kwame Donaldson
Across the nation, apartment construction is booming in the most affluent neighborhoods, with growth rates three times higher than in the least affluent areas. This surge underscores rising demand for upscale rentals, driven by factors such as increasing mortgage rates and evolving preferences for renting among affluent households. For property managers, this trend presents both significant opportunities and the need to adapt to changing tenant demographics and preferences. Learn more in this market update.
Apartment Construction Surges in Tulsa’s High-Wage Districts
The downtown area of Tulsa, Oklahoma is the city’s most high-profile community. The district includes Tulsa’s city hall, the city’s primary entertainment, convention, and performing arts venues, and the second-tallest building in Oklahoma. The north end of downtown features Tulsa’s art district, where patrons can enjoy galleries, festivals, restaurants, and night life. A ribbon of freeways surrounds Downtown Tulsa and facilitates access to and from all corners of the urban area.
With so much to offer, it’s no surprise that ZIP code 74103, which overlaps with most of Downtown Tulsa, attracts many of the city’s wealthiest residents. According to the latest data compiled by the U.S. Census Bureau, 19.1% of households in 74103 earn more than $200,000 per year, which is the largest share of high-income earners among all 20 of the ZIP codes in the Tulsa metro area. In addition, renters in Downtown Tulsa occupy the metro area’s smallest apartment units and pay its second highest median rent.
This market profile has caught the eye of apartment developers; Downtown Tulsa is adding rental units faster than any other ZIP code in the metro area. Based on Census Bureau data, there are only 576 occupied rental units in 74103, but construction data compiled by AppFolio’s data providers point to 386 rental units planned or under construction for the district. When this construction is completed, the number of apartment units in Downtown Tulsa will swell by 67%, which is substantially faster than the metrowide growth rate of 9%.
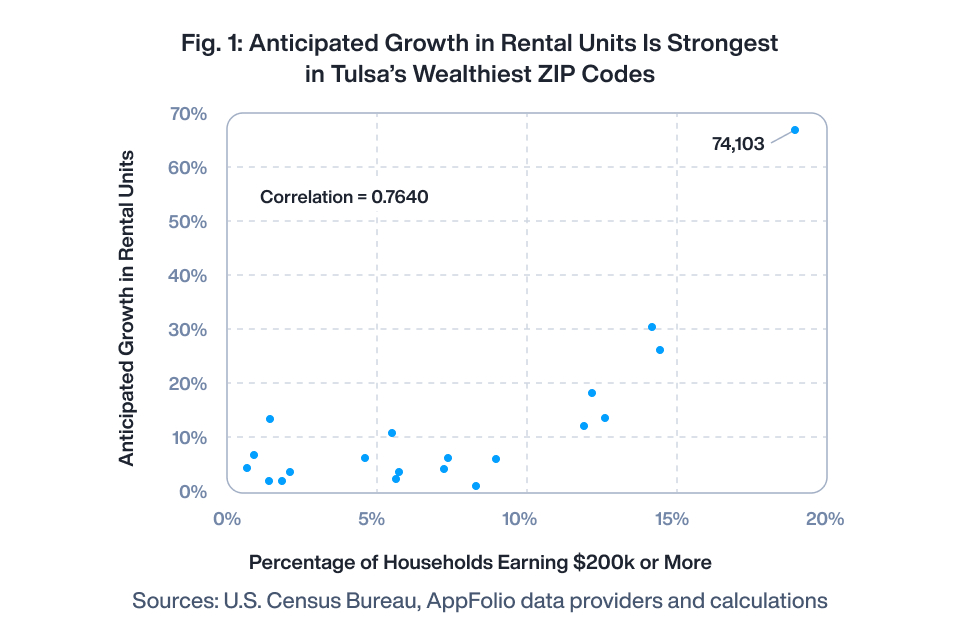
The connection between affluent households and robust rental unit growth is not limited to Downtown Tulsa. Across the metro area, every ZIP code with a significant share of high-wage earners has a healthy rate of apartment construction. In Figure 1, each dot represents a ZIP code in the Tulsa metro area; we see that the 6 ZIP codes where high-income earners make up more than 10% of households each rank among the 7 fastest growing districts for rental unit growth. The correlation between household earnings and apartment growth in all of Tulsa’s ZIP codes is 0.76, which is strong.
Widespread Link Between Household Earnings and Multifamily Construction
Tulsa is not the only metro area where we observe a positive correlation between the ZIP codes’ share of high-income earners and apartment growth. AppFolio repeated the analysis in Figure 1 for all 129 metro areas with at least 10 ZIP codes where data is available for both variables, and we summarize our results in Table 1. Nationwide, we find that positive correlations between household earnings and anticipated rental unit growth, as detected in Tulsa, are more than twice as common as negative correlations.
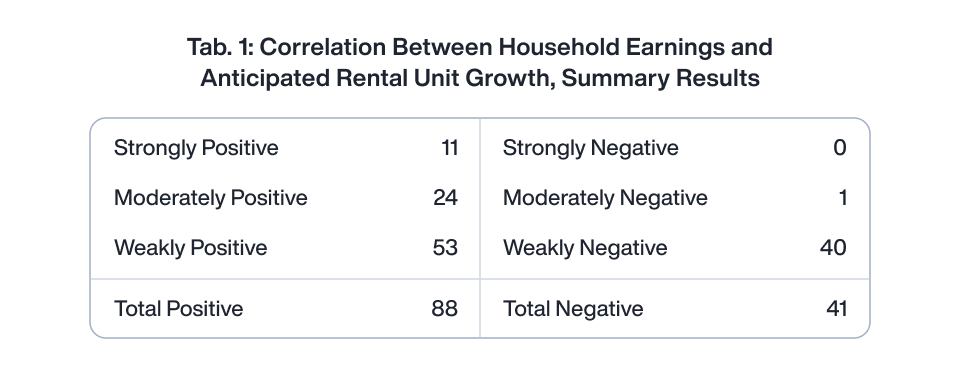
Table 1 also shows that the correlation is strongly or moderately positive in 35 metro areas, a collection that includes large and medium-sized cities from every region in the country. The trends that we observe in these metro areas are most like what we observe in Figure 1; the upward-sloping relationship between ZIP code-level earnings and anticipated rental unit growth in any of these 35 cities would be apparent on a scatterplot of these two variables.
By contrast, Myrtle Beach, South Carolina is the only metro area where the link between household earnings and anticipated apartment growth is strongly or moderately negative. This stands to reason. The highest-income ZIP codes in Myrtle Beach are oceanfront districts on densely developed barrier islands; opportunities for large-scale multifamily construction projects in these neighborhoods are limited.
To gauge the nationwide strength of the link between neighborhood earnings and apartment construction, AppFolio reviewed all 129 metro areas with at least 10 ZIP codes of data. Though this sample represents a minority of the 393 metro areas recognized by the Census Bureau, these cities are home to 73% of renter households in the U.S. We divided the ZIP codes for each of these metro areas into 10 equal-sized groups, or deciles, based on the share of households earning $200,000 or more per year. The lowest decile consists of ZIP codes where the share of high-income earners is in the bottom 10% of the metro area, the second-lowest decile captures the next 10%, and so on.
We then grouped together all the ZIP codes for each decile, regardless of metro area, and calculated the anticipated rate of rental unit growth for each group. These final 10 groupings are ZIP code deciles. By sprinkling 10% of ZIP codes from every metro area into each ZIP code decile, we controlled for observed and unobserved metro-level effects, which include varying state and municipal government tax and spending policies, distinct characteristics of local labor or housing markets, and meteorological, topographical, or geographical differences.

Figure 2 plots the anticipated rate of apartment growth for each ZIP code decile. Our analysis reveals that rental units in the most affluent ZIP codes will grow almost three times faster than those in the least affluent districts. Growth in the other 8 ZIP code deciles progresses in a near perfect, stepwise pattern. This result establishes that the correlation between neighborhood-level income and apartment growth that we observed in Tulsa is replicated across the nation.
Analysis and Forecast
Robust apartment construction in high-income ZIP codes is supported by cyclical and longer-term market trends. Soaring mortgage rates and inflated house prices have trapped many would-be homeowners in rental units. As a result, apartment residents in 2025 are older and more affluent than ever before. According to Census Bureau data, the average household income for renters has swelled 7% per year since 2022 (versus 5.3% for homeowners). These wealthier residents can afford to lease apartments in high-rent districts where construction growth is strongest. But with some analysts projecting a drop in home values this year, demand for pricey rental units could soon be siphoned away by the housing market.
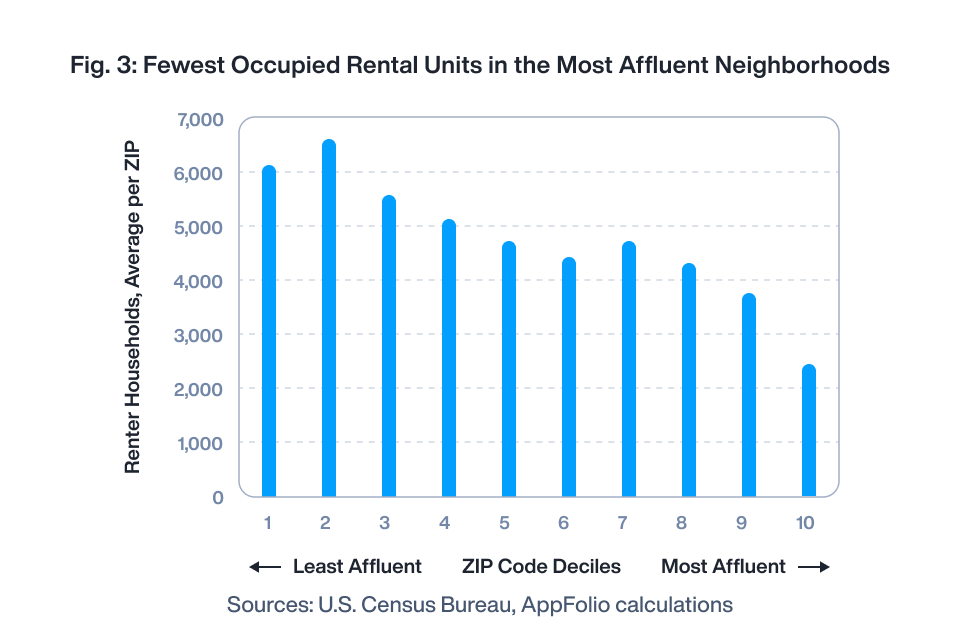
Apartment construction in high-income communities is also supported by vanishing opposition to these projects. In Figure 3, we see that the least affluent ZIP codes have more than twice as many existing renter households as the most affluent ZIP codes. Anticipated rental unit growth is faster in wealthier areas because there are so few apartments currently in these neighborhoods. Not-in-my-backyard resistance to upscale rental units is softening, and these shifting preferences should sustain supply in high-income areas over the longer term.
Opportunities for Property Managers
Annual income for renters has reached a record high, and these residents are more concentrated in affluent, amenity-rich districts. Meeting the expectations of these households requires not only high-quality properties but also elevated levels of service and operational excellence. Attracting and retaining high-income renters in these competitive markets will become even more important as housing costs moderate, leading many renters to become homeowners.
In this environment, offering concierge-style experiences such as seamless move-ins, instant communication, and lease-attached resident services can be powerful differentiators. To stand out in a demanding market where affluent renters are looking for more than just a place to live — they’re seeking comfort, convenience, and a sense of elevated living — property managers and owners need to be armed with the most current data on what these renters expect. Our 2025 Resident Preferences Report, which surveyed over 2,000 U.S. renters, offers data-driven insights to help you exceed the expectations of the modern renter and deliver standout service in a highly competitive market. You can check out the report here.


