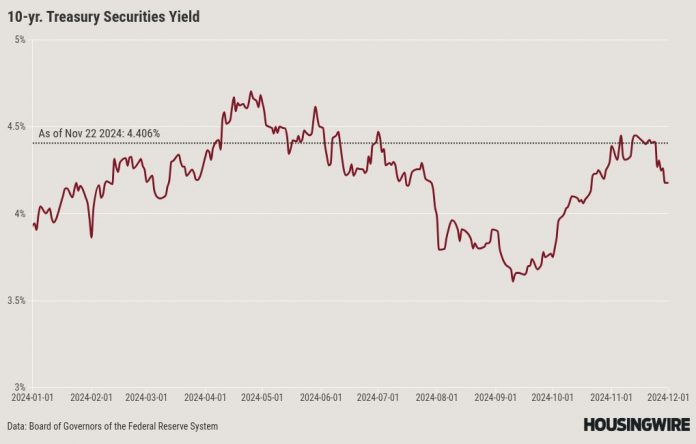
Despite initial concerns that tariffs would push mortgage rates up to 8% and reduce housing demand, this week has brought some encouraging news. The 10-year yield has remained stable at a crucial technical level and even reversed direction, resulting in improved mortgage rates. Additionally, housing demand has surprisingly held up, even with elevated mortgage rates.
While the increase in demand may not be significant, it’s still a positive development, and that’s worth celebrating! Let’s take a look at the latest housing data to gain insights into the market as we approach the end of the year.
10-year yield and mortgage rates
My 2024 forecast included:
- A range for mortgage rates between 7.25%-5.75%
- A range for the 10-year yield between 4.25%-3.21%
The recent decrease in mortgage rates can be attributed to dynamics in the bond market and the current sentiment among bond traders. They see potential gains by purchasing the 10-year bond at its current level, especially now that the Citigroup Economic Surprise Index has peaked in the short term and has faded.
Previously, there was significant concern about the possibility of a new wave of inflation, which would require raising interest rates, which I threw cold water on in a recent HousingWire Daily podcast. However, the recent peak in the 10-year yield was around 5% in 2023, and the downtrend from that level is intact for now. So, as long as economic data doesn’t surprise the upside, bond yields should stay far away from 5%, which means mortgage rates won’t get close to 8%.
When I talk about a Santa Clause rally, I mean people buying the 10-year yield and driving mortgage rates lower, due to the slow dance between the 10-year yield and mortgage rates. This is what happened in the last two years. We’ll see if we get a repeat this year.
Mortgage spreads
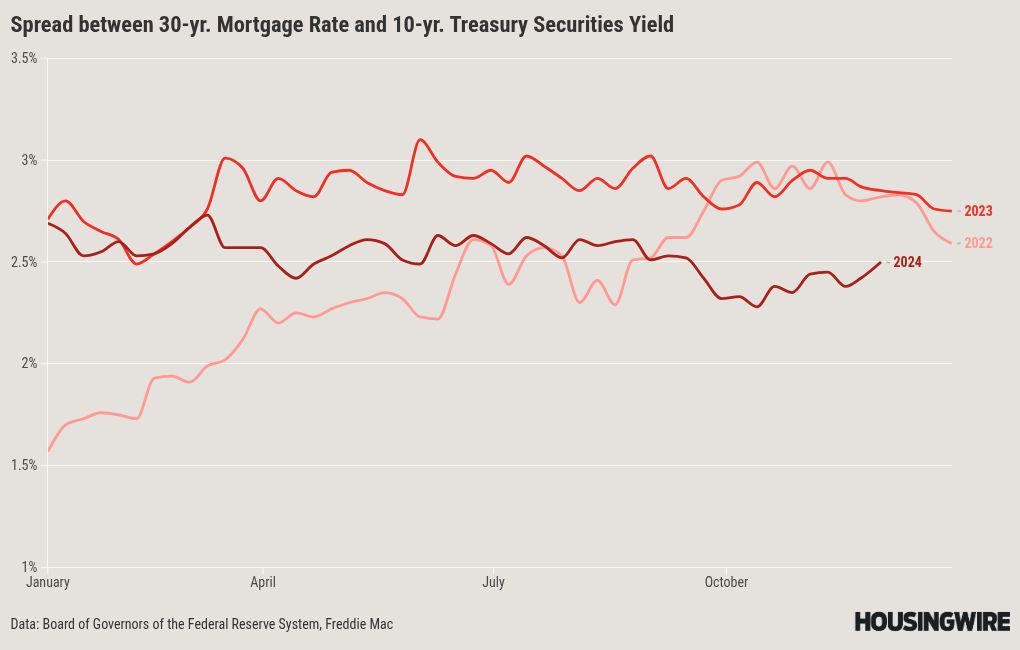
The mortgage spread situation has improved in 2024, especially compared to the tough times in 2023. Thanks to this positive change, mortgage rates reached 6% without the 10-year yield reaching 3.37% in 2024. Just imagine if spreads hadn’t improved — mortgage rates could be over 7.50% right now!
While we’ve seen a slight increase in spreads since mortgage rates started rising in September, it’s important to note that they’re still in a much better place than the peak levels we experienced last year. If spreads had remained as high as in 2023, mortgage rates today would be about 0.60% higher. On the flip side, if we were looking at average spreads, we would see mortgage rates dropping by around 0.93% to 1.03%. Overall, it’s encouraging to see progress in the mortgage market!
Weekly pending sales
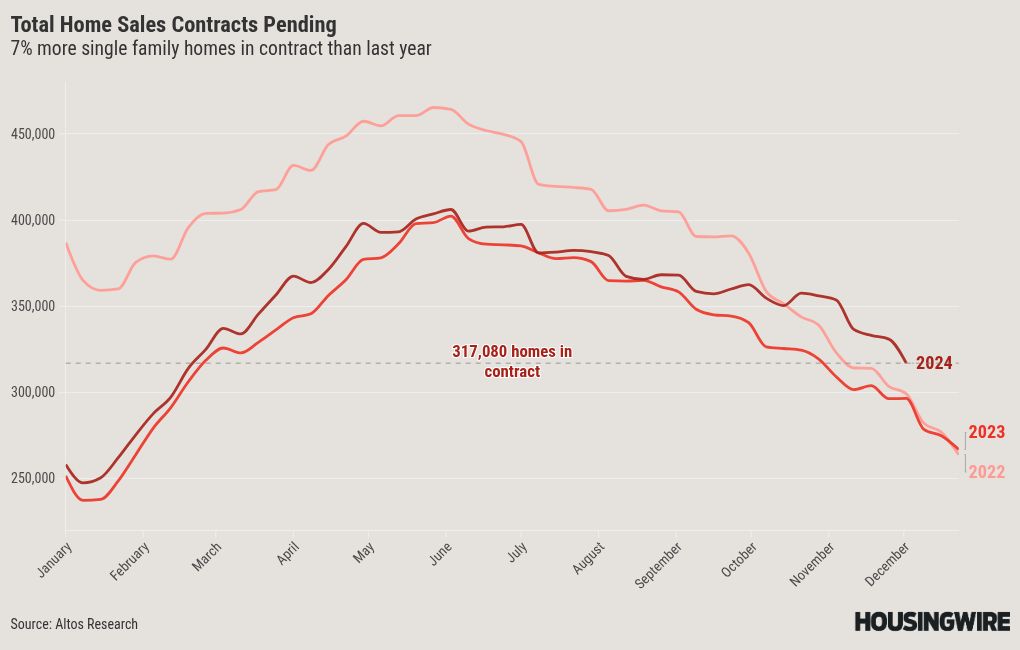
The weekly pending contract data from Altos Research gives us an extraordinary glimpse into real-time housing demand. It’s interesting to see how this data follows seasonal trends, as shown in the chart below. At first, we saw some solid performance when mortgage rates were close to 6%. It’s encouraging to see pending contracts holding up year over year, even though home prices and mortgage rates have been higher recently. This trend has piqued my interest, and I’m excited to keep an eye on it! Imagine if mortgage rates just stayed in a range between 5.75%-6.25% for 12 months.
This is the weekly pending sales for last week over the previous few years:
- 2024: 317,080
2023: 296,615
2022: 299,312
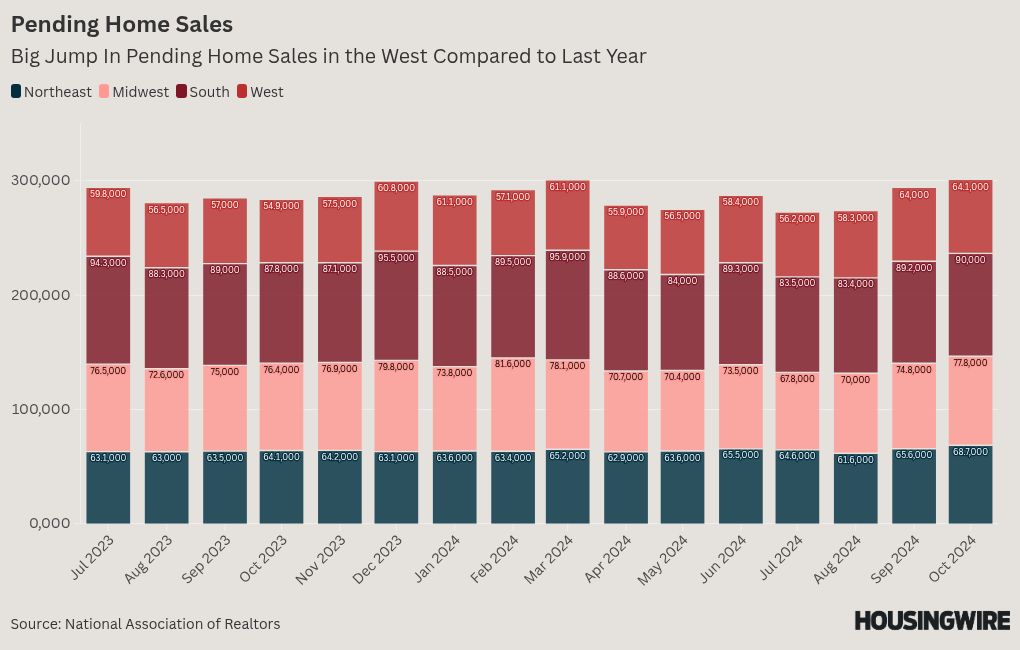
While our pending contract data showed year-over-year growth months ago, the NAR’s pending home sales have only now caught up.
Purchase application data
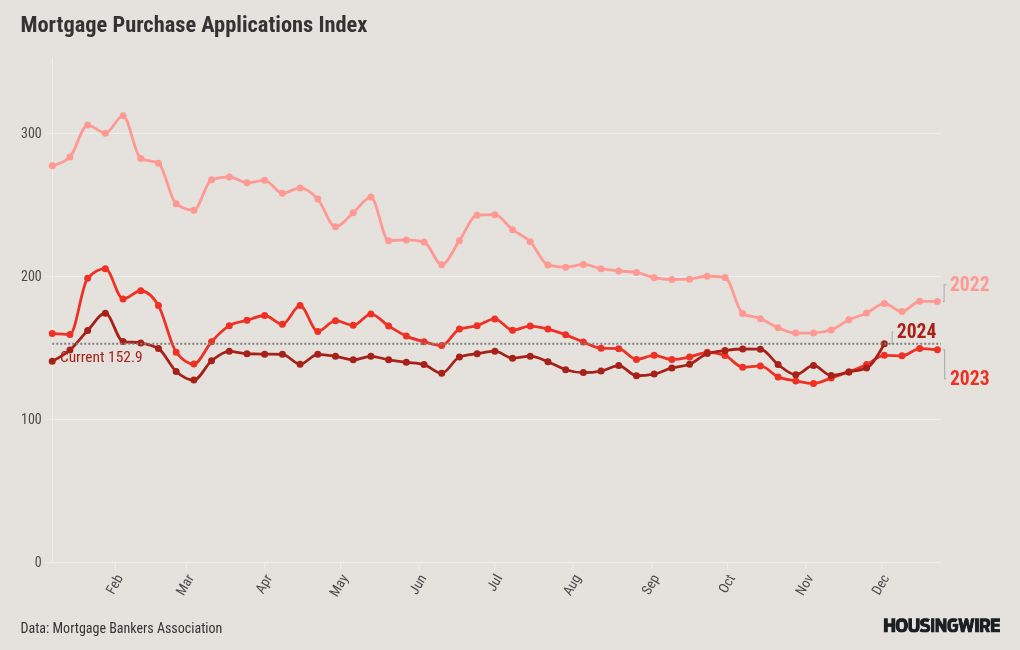
The recent purchase application data was quite surprising. Whenever mortgage rates rise from a lower trend, the effects are adverse for some time. However, last week’s purchase apps data showed 12% week-to-week growth, which now makes a positive trend for the previous seven weeks, which was not in my bingo card for the holidays. The last seven weeks:
When mortgage rates were running higher earlier in the year (between 6.75%-7.50%), this is what the purchase application data looked like:
- 14 negative prints
- 2 flat prints
- 2 positive prints
When mortgage rates started falling in mid-June, here’s what purchase applications looked like:
- 12 positive prints
- 5 negative prints
- 1 flat print
With two years of data, we observe a positive growth trend in purchase applications when mortgage rates approach 6%.
Weekly housing inventory data
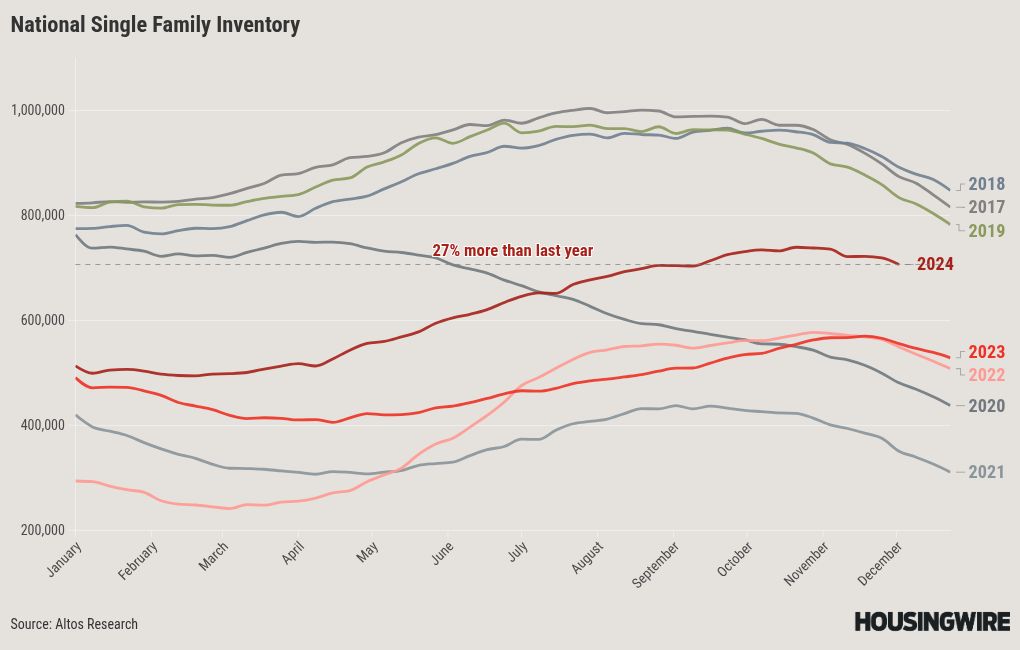
Housing inventory fell last week, which is typical at this time of year. We should expect a decline in inventory until the spring season starts heating up again. The peak in 2024 inventory will be 739,434, which isn’t a normal level for inventory, but at least we’ve seen good, healthy growth this year. The year-over-year inventory growth is the best housing story for 2024.
- Weekly inventory change (Nov. 22-Nov. 29): Inventory fell from 719,055 to 706,554
- The same week last year (Nov. 24-Nov. 30): Inventory fell from 565,875 to 555,717
- The all-time inventory bottom was in 2022 at 240,497
- The inventory peak for 2024 so far is 739,434
- For some context, active listings for this week in 2015 were 1,082,020
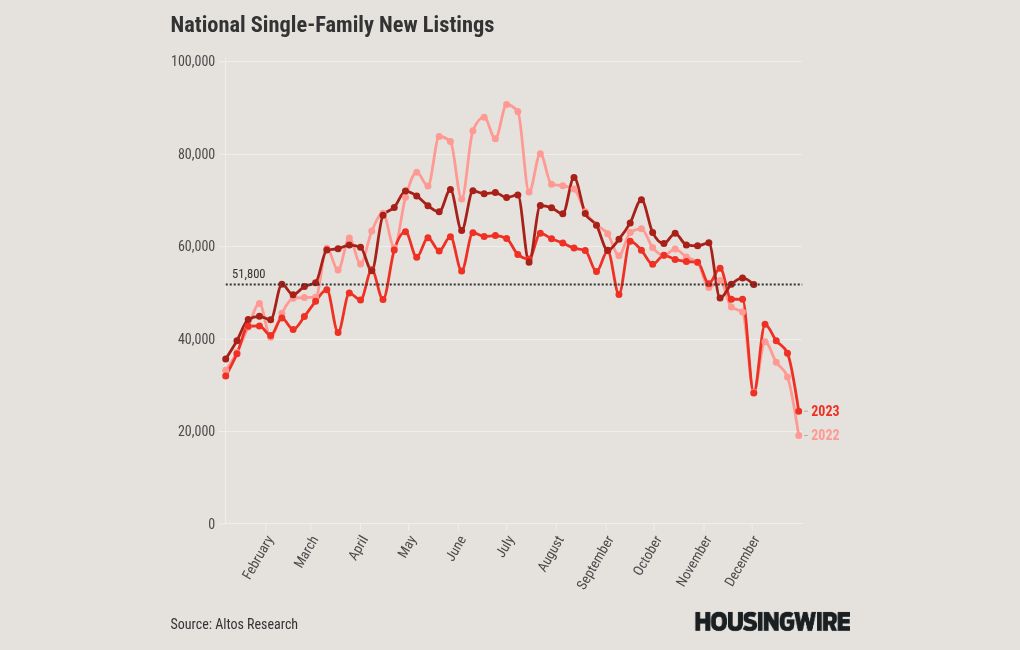
Currently, new listings data is experiencing a seasonal decline, with a slight decrease observed last week. We can expect an even more significant seasonal decline this week.
Although I underestimated the growth of new listings data during the peak seasonal weeks by 5,000, it is encouraging that we saw growth in 2024. However, it’s worth noting that both 2023 and 2024 will be recorded as the two lowest years for new listings in history. The idea that homeowners would rush to sell their homes in large numbers is just wrong. American homeowners do not behave like stock traders or get swept up in sensationalist online content of YouTube doomers. They simply go about their normal lives each day.
New listings data for last week:
- 2024: 51,800
- 2023: 28,297
- 2022: 28,471
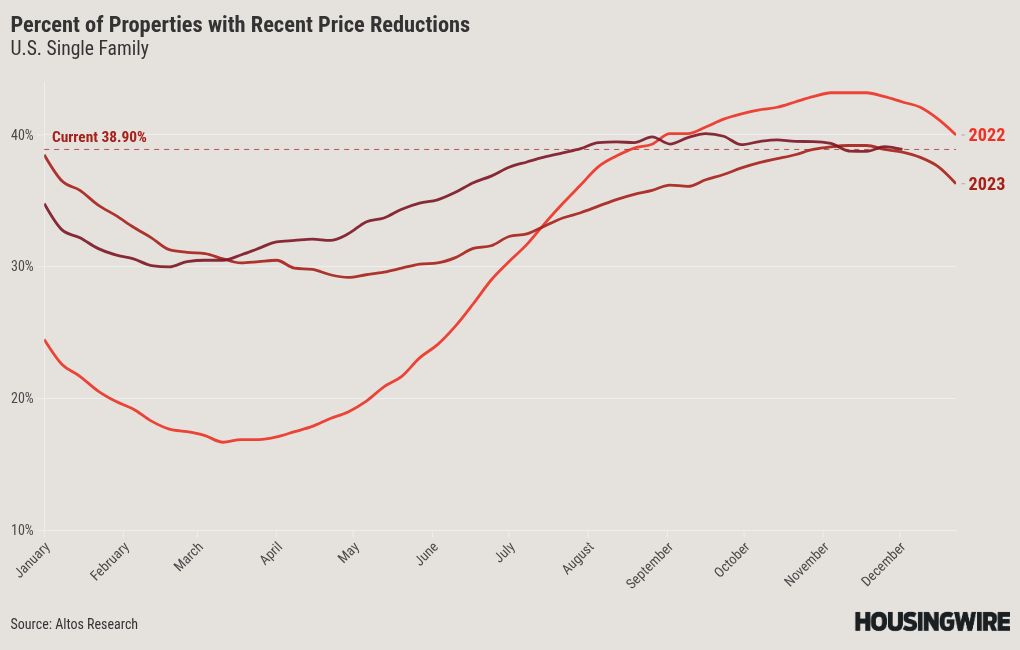
In an average year, about one-third of all homes experience a price cut, which is typical in the housing market. When mortgage rates increase, the percentage of homes reducing their prices tends to rise. Conversely, this trend can slow down when rates decrease and demand increases, as we recently saw when rates fell. However, mortgage rates have risen again. We are at the same levels as last year despite having more inventory available.
Here are the price-cut percentages for last week compared to previous years:
- 2024: 38.7%
- 2023: 39%
2022:43%
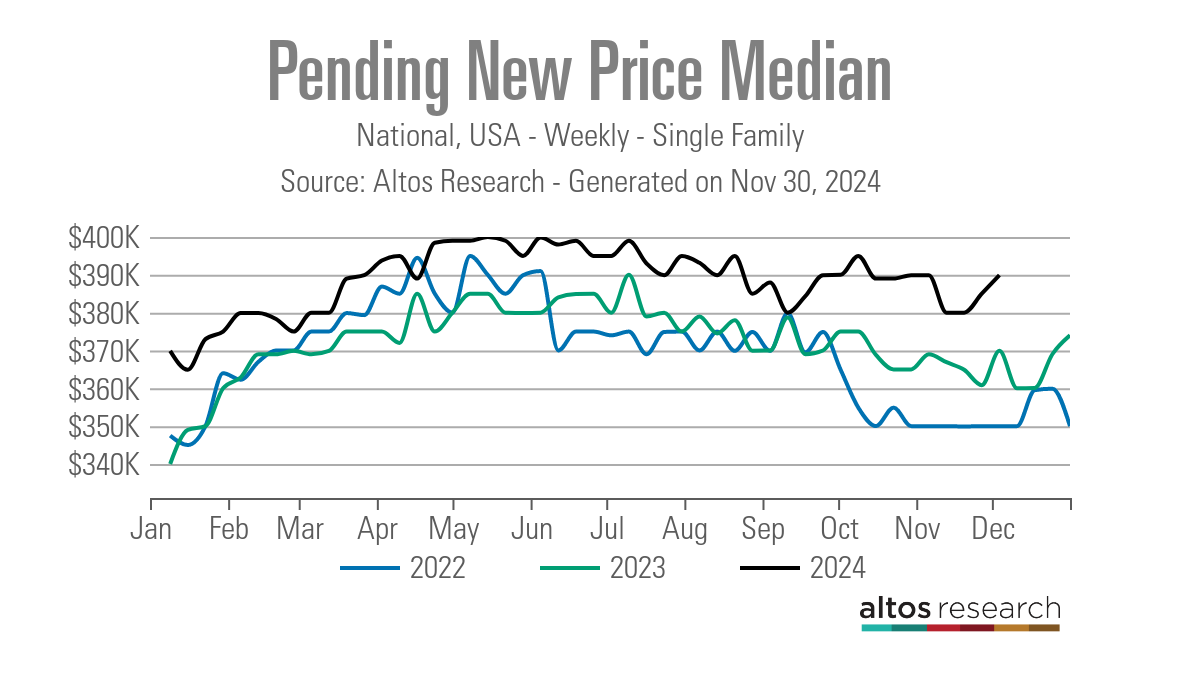
One thing that has surprised me in the 2nd half of 2024 is how resilient our pending new home price index has been in a soft seasonal period, with higher inventory and mortgage rates above 6%.
The week ahead: Jobs week!
There will be a lot to discuss this week — it’s the most critical week of the month for economic data because it’s jobs week! We have several key reports, including job openings, the ADP report, jobless claims, and the significant BLS Jobs report scheduled for Friday. We’ve already observed a notable drop in yields, so it will be interesting to see what happens next with mortgage rates. We also have ISM data, bond auctions, and some Fed presidents speaking. So buckle up once again,n and let’s see how the bond market reacts to this week’s data.
